The Fundamental Theorem of Algebra
The Fundamental Theorem of Algebra says that “every one-variable polynomial of degree \(n\) has exactly \(n\) complex roots.”
Complex Roots
The standard form of a complex number is \(a + bi\), \(a\) being real and \(bi\) being imaginary. All real roots are complex roots. This means numbers like \(11\), \(291\), and \(3\) can all be roots. All real numbers are complex numbers, and all real roots are complex roots, because when \(b = 0\), the number is equal to \(a\).
Degree of 2
Let’s look at this equation
\[ x^2 - 3x + 2 \]
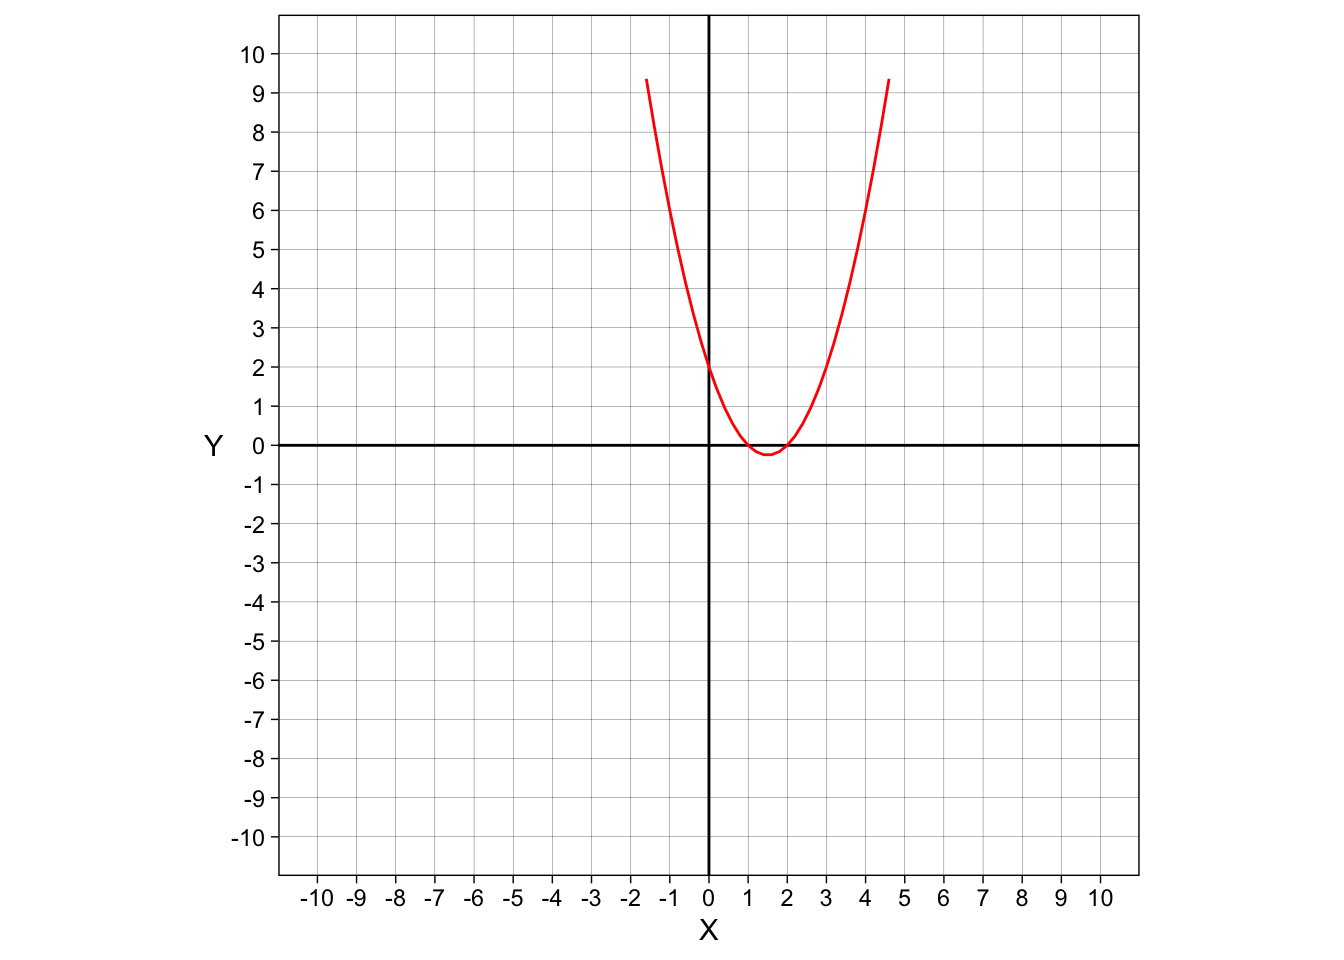
The leading term (\(x\) squared) has a degree of 2. If we graph this, we should have exactly 2 complex roots.
NoteThe code
Here’s the code behind the graph:
Code
q <- function(x) {
  x^2 - 3*x + 2
}

ggplot() +
  geom_hline(yintercept = 0) +
  geom_vline(xintercept = 0) +
  geom_function(fun = q, color = "red") +
  coord_fixed(xlim = c(-10, 10), ylim= c(-10, 10)) +
  scale_x_continuous(breaks = -10:10, limits = c(-10, 10))+
  scale_y_continuous(breaks = -10:10, limits = c(-10, 10))+
  labs(x = "X",
       y = "Y")+
  theme_linedraw()+
  theme(
    panel.grid.minor = element_blank(),
    axis.title.y = element_text(angle = 0, vjust = 0.5)
  )
We can see that the parabola intersects the x-axis at 1 and 2. These are our 2 complex roots! Roots, or zeros, are the intercepts on a graph, or the place where \(y\) (or \(x\) if the parabola is horizontal) is equal to zero.
Degree of 3
All real roots
Let’s use the equation
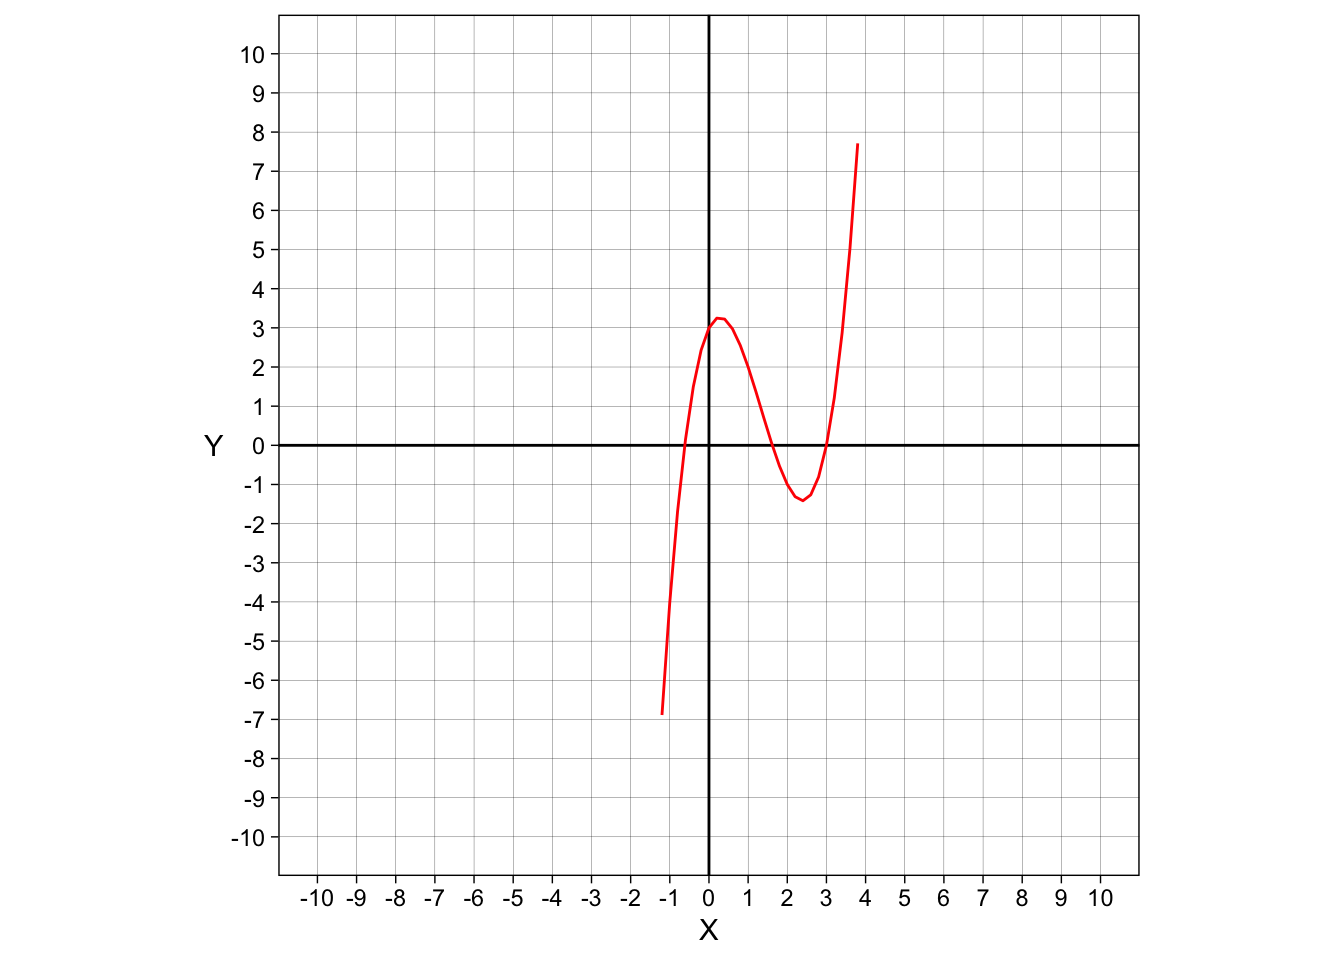
\[x^3-4x^2+2x+3\] This is a cubic polynomial (a polynomial with degree \(3\)), which means it will have exactly 3 roots.
NoteThe code
Here’s the code behind the graph:
The roots here all pass through the x-axis, and the various intercepts/zeros are \(-0.6\), \(1.6\), and \(3\). But a cubic polynomial passing through the x-axis all three times isn’t always the case.
Odd degree polynomials
A polynomial with an odd degree must have at least 1 real root. Nonreal roots come in conjugate pairs, which means that there would be an even number
When something is a conjugate pair, you flip the sign of the imaginary term. Subtraction becomes addition, addition becomes subtraction.
\(a+bi\) is the conjugate of \(a - bi\)
We can write conjugate pairs like \(a\pm bi\)
Nonreal Roots with odd degree polynomials
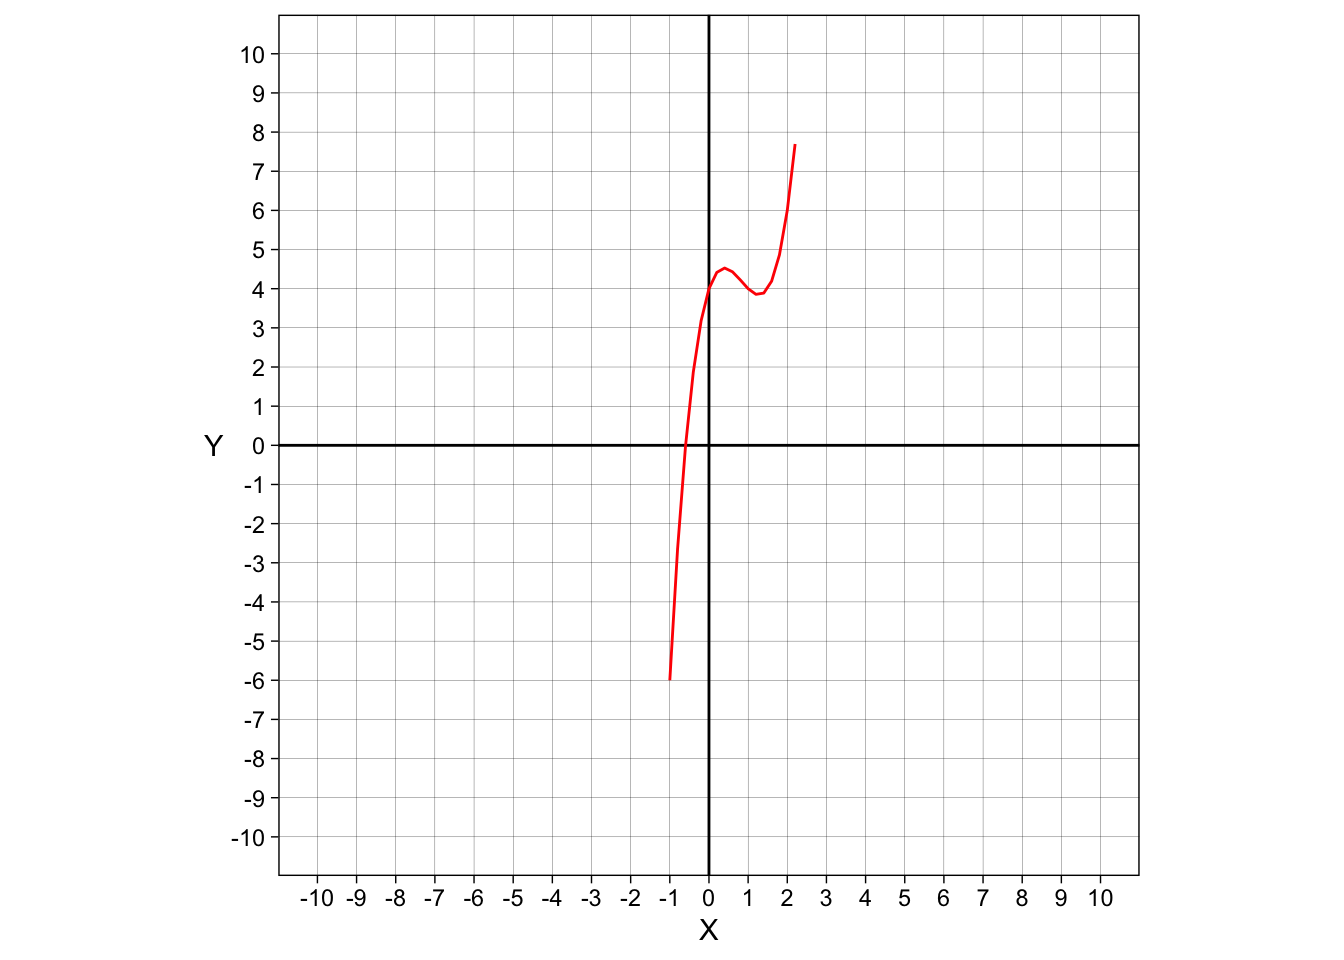
\[ 2x^3 - 5x^2 + 3x +4 \] This equation is a cubic polynomial. Let’s graph this:
NoteThe code
Here’s the code behind the graph:
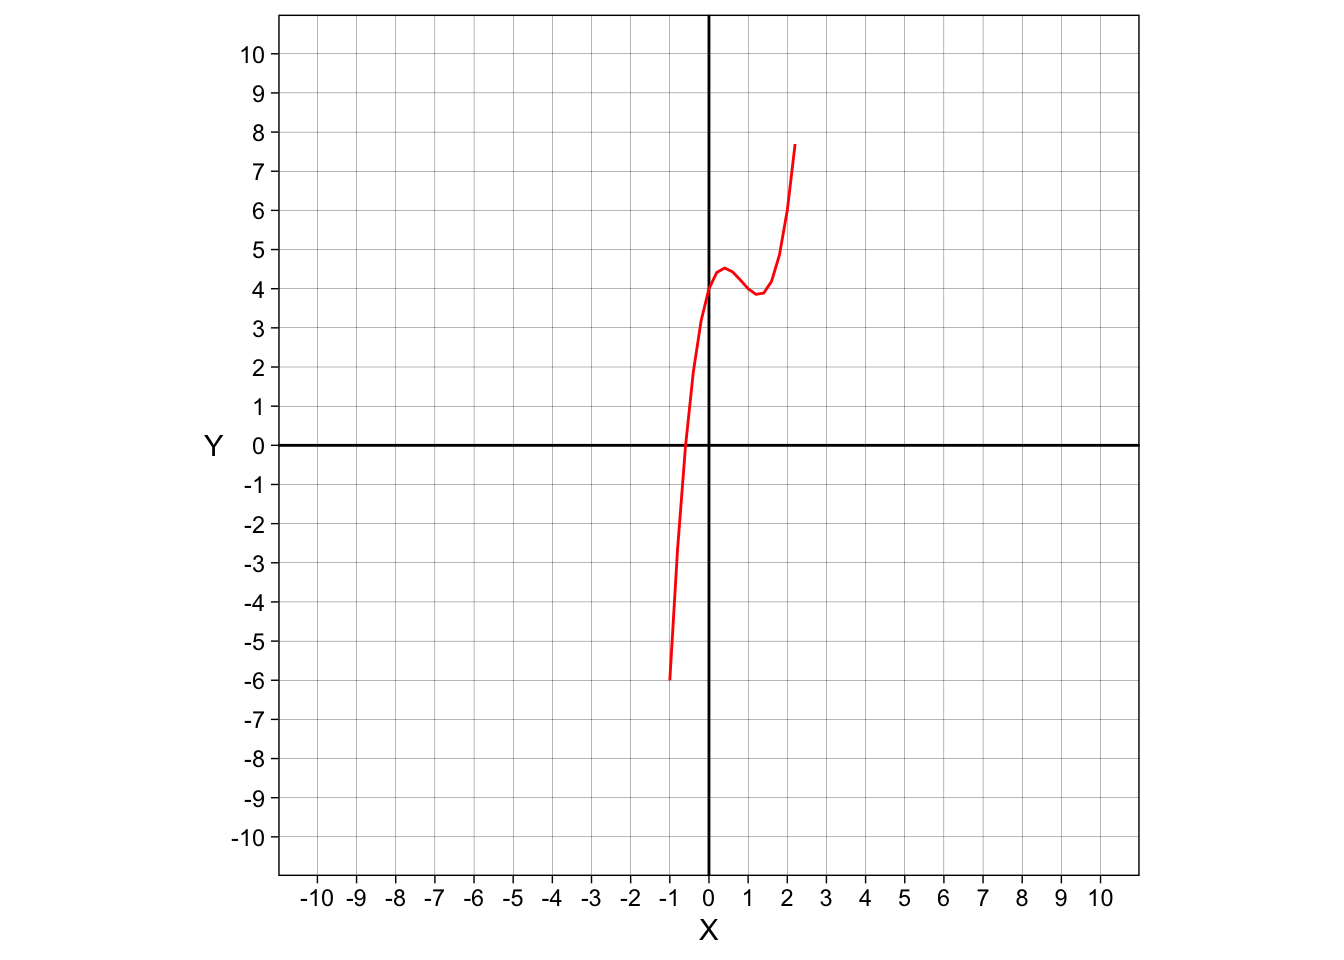
The cubic polynomial only passes through the x-axis one time. The “down-up” part of the graph has no intercepts. These two roots are nonreal. The roots for this equation are \(0.5\) and \(\approx1.5 \pm 0.97i\)
Important
Nonreal roots ALWAYS come in conjugate pairs
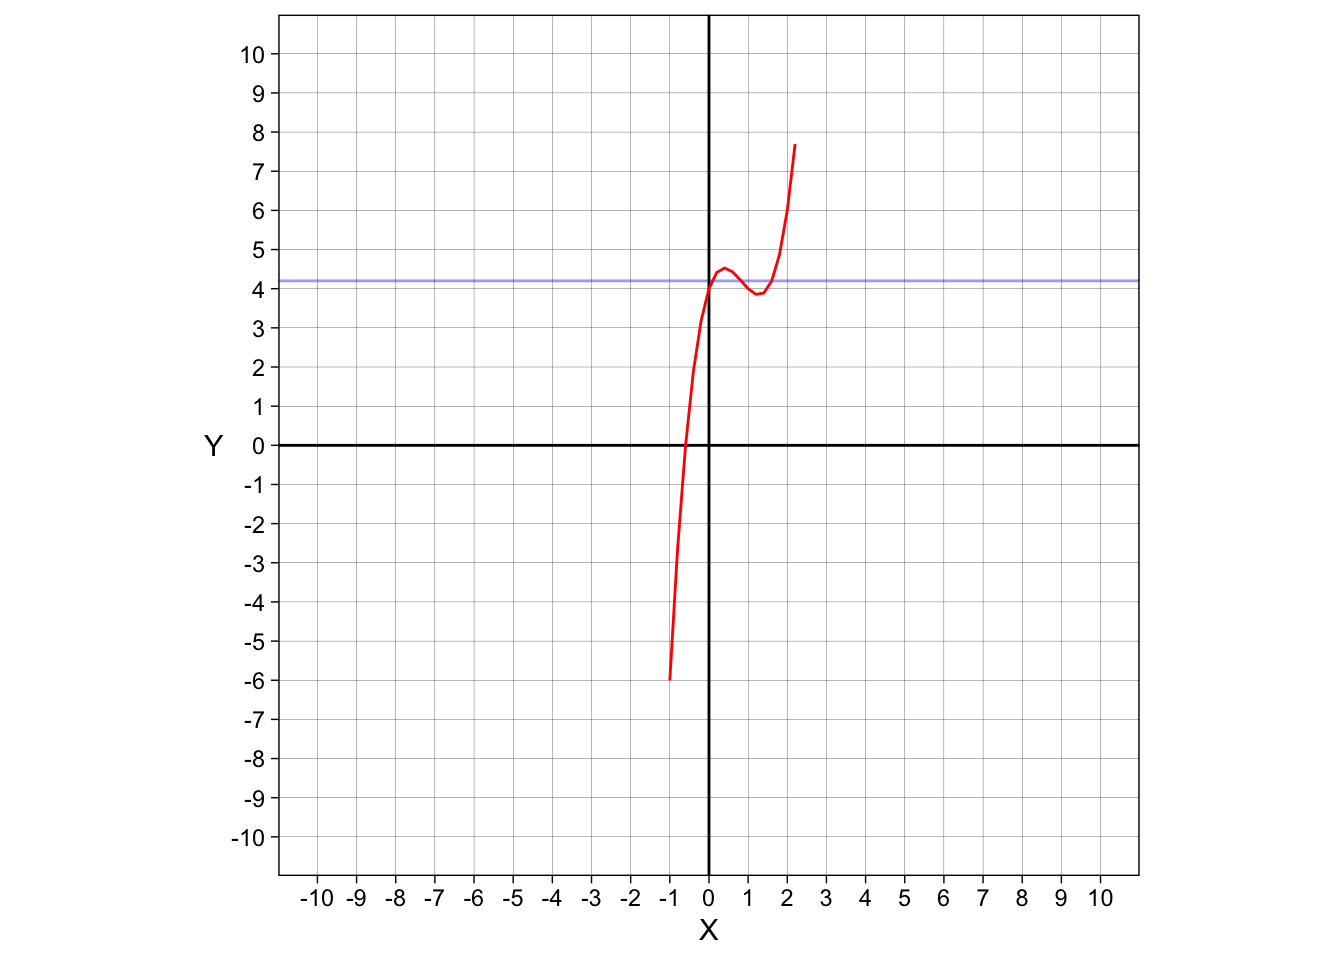
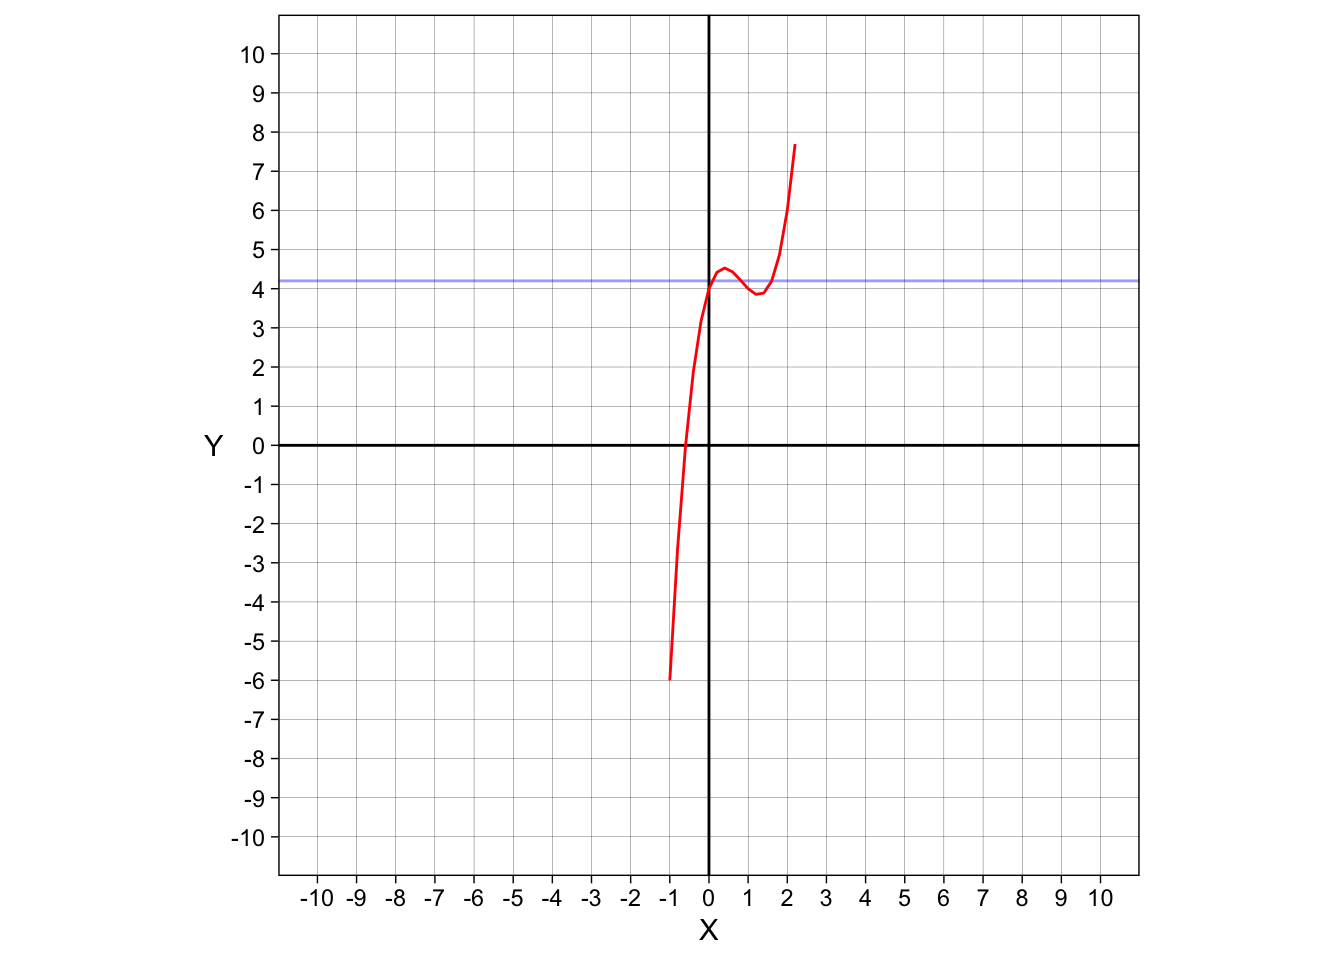
We can draw a different line for the x-intercepts that are higher up. This shows that they are roots, they just don’t pass through the x-axis.
NoteThe code
Here’s the code behind the graph:
Code
t <- function(x) {
  2*x^3 - 5*x^2 + 3*x +4
}

ggplot() +
  geom_hline(yintercept = 0) +
  geom_hline(yintercept = 4.2, alpha = 0.4, color = "blue")+
  geom_vline(xintercept = 0) +
  geom_function(fun = t, color = "red") +
  coord_fixed(xlim = c(-10, 10), ylim= c(-10, 10)) +
  scale_x_continuous(breaks = -10:10, limits = c(-10, 10))+
  scale_y_continuous(breaks = -10:10, limits = c(-10, 10))+
  labs(x = "X",
       y = "Y")+
  theme_linedraw()+
  theme(
    panel.grid.minor = element_blank(),
    axis.title.y = element_text(angle = 0, vjust = 0.5)
  )
Even degree polynomials
Real roots with even degree polynomials
Parabolas—being to the 2nd power, can only have 2 roots. This means that both of them are real, or both of them are nonreal. Quartic polynomials are a little bit different. They can either have all real, 2 real, or none real. Let’s take a look at this quartic polynomial.
\[x^4-2x^3-3x^2+5x+1\]
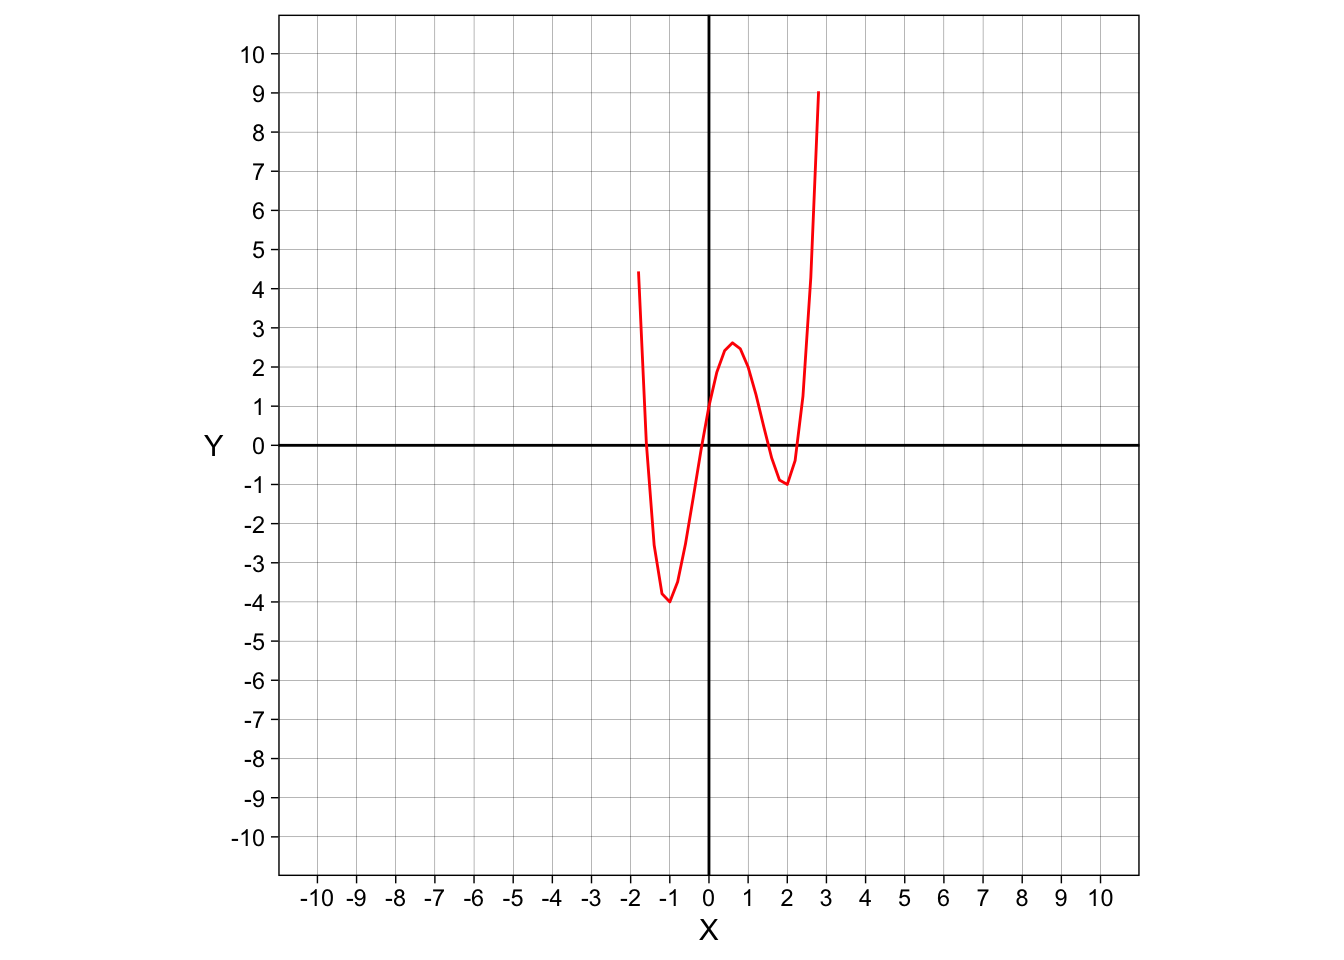
The roots here are \(-1.6\), \(-0.2\), \(0.5\), and \(2.3\). We have exactly 4, and all of them are real.
Nonreal roots with even degree polynomials
All nonreal
\[x^4-1x^3-3x^2+3x+7\] This polynomial has degree 4, so it will have 4 roots.
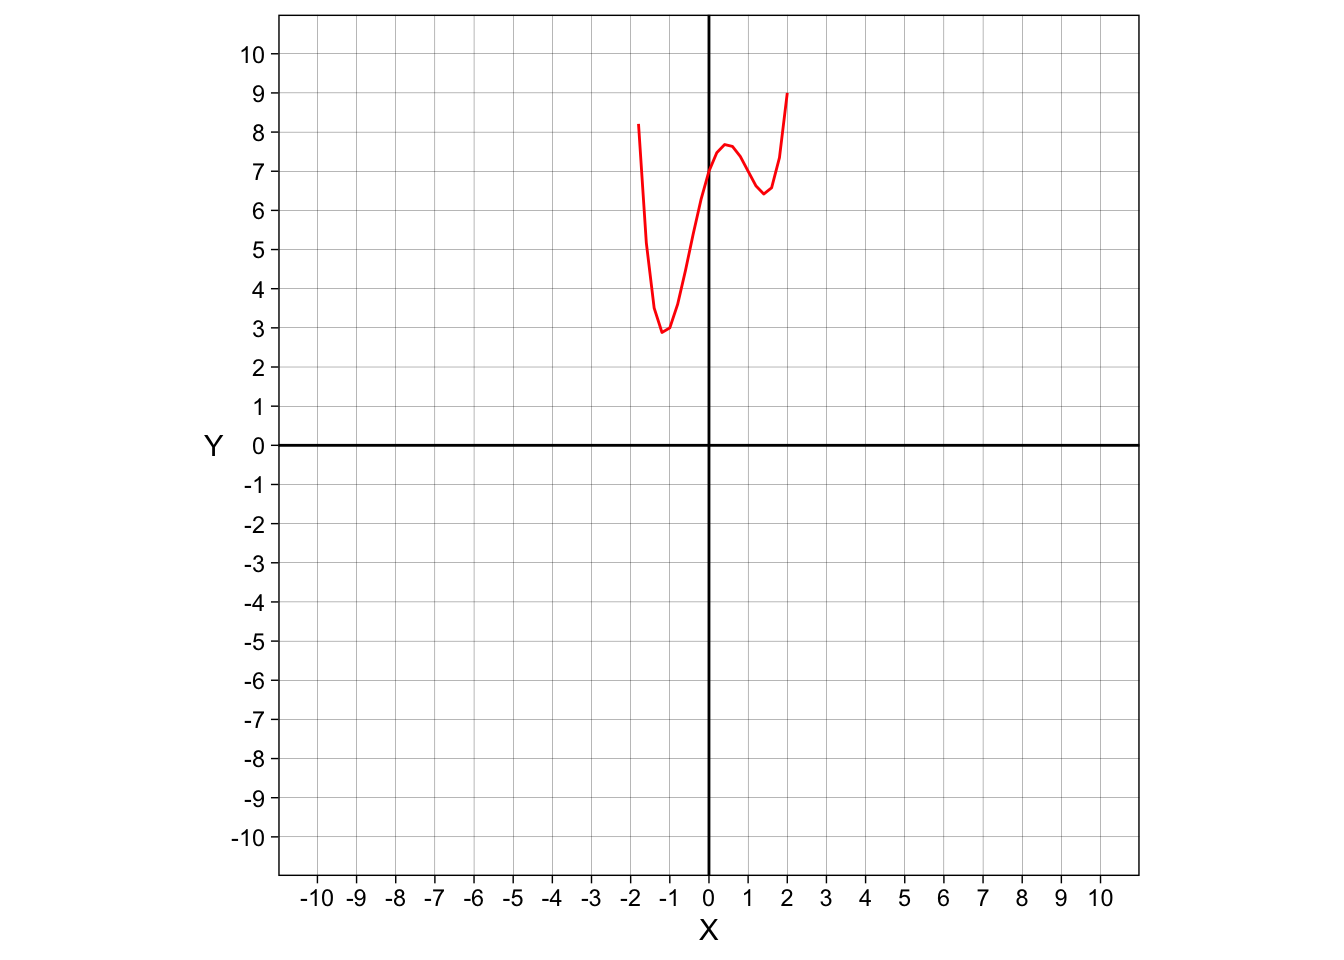
As you can see, no lines intersect the x-axis, and none of the roots are real. The roots here are \(\approx-1.3\pm0.6i\) and \(\approx1.7\pm0.9i\)
Some nonreal
We can go through the same process for a graph that produces 2 real and 2 nonreal roots
\[x^4-x^3-4x^2+x-3\]
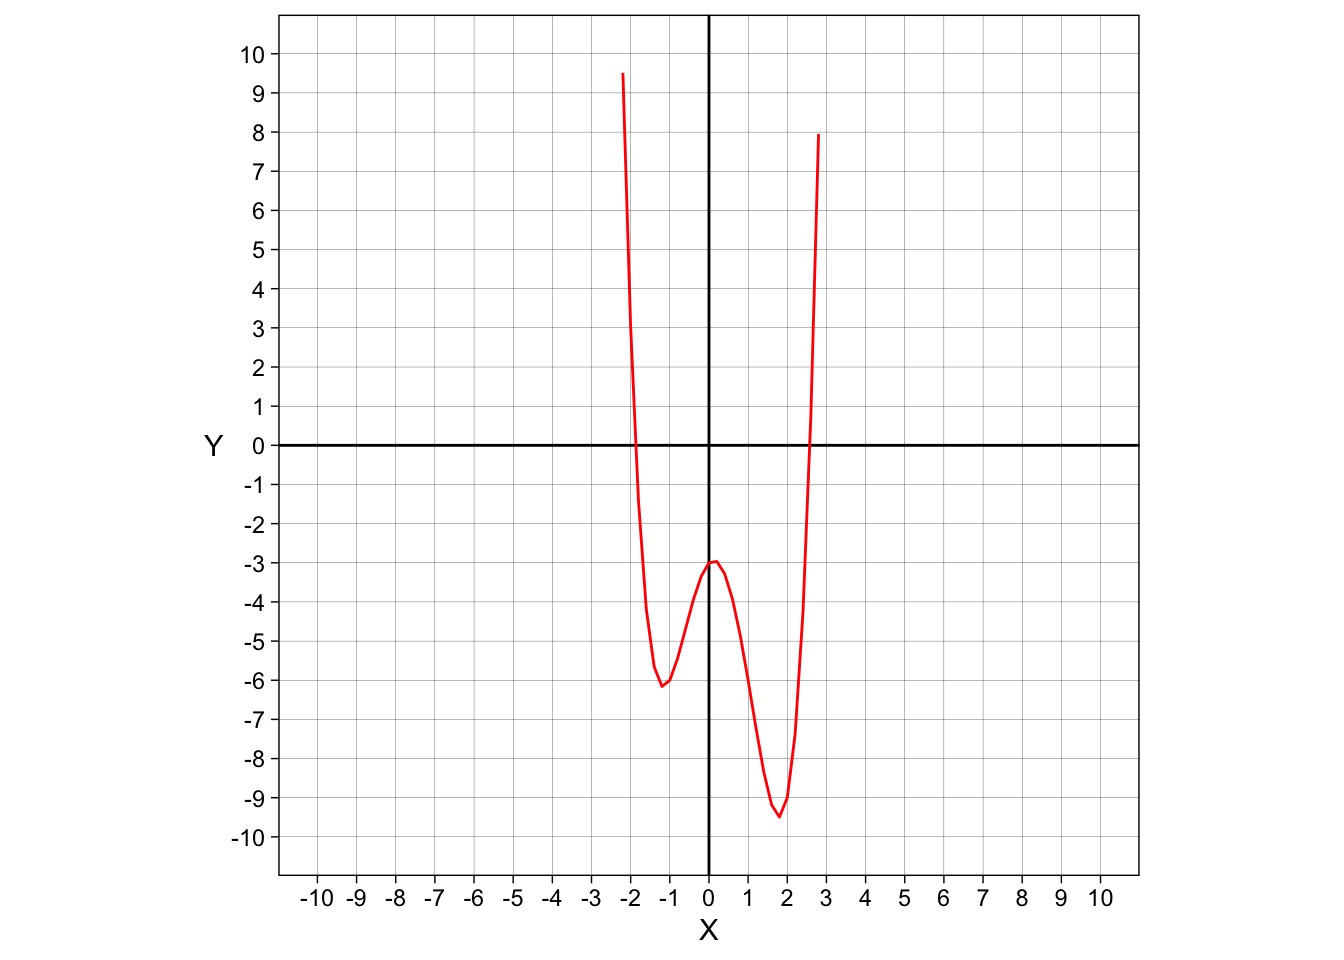
The roots here are \(-2\), \(2.5\), with the conjugate pair \(\approx 0.1\pm0.7i\)
Multiplicity
Multiplicity occurs when a line “bounces” off of the x (or y) axis. Let me show you what I mean…
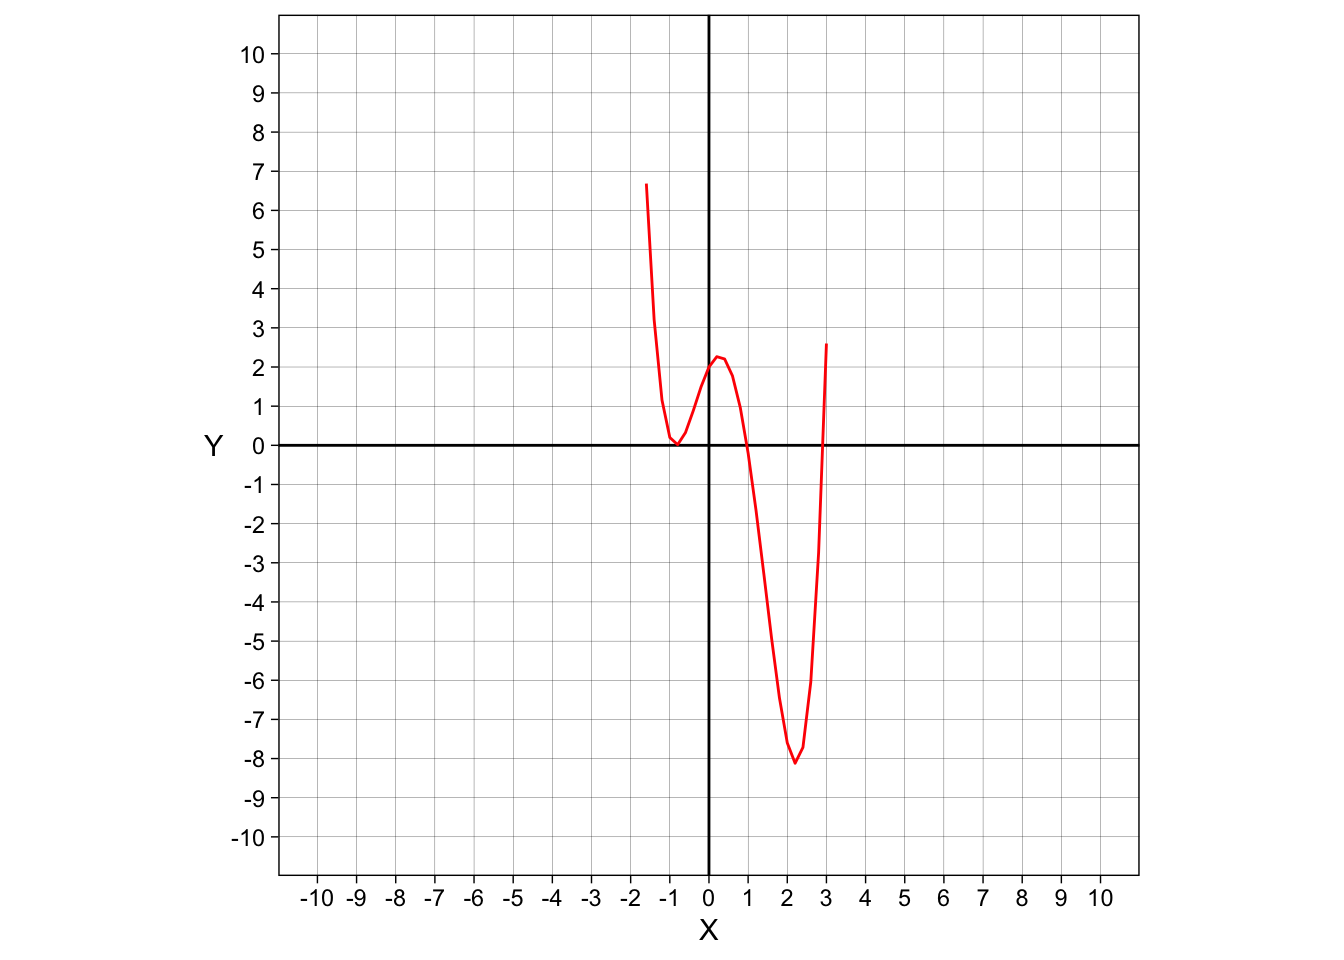
In this graph, the first “down-up” doesn’t technically intersect the x axis, but it’s also not floating around elsewhere. This is a double root. Double roots are pretty much the same things as multiplicity.
Double Roots
When we find the roots of any polynomial, we are simplifying it. Here’s an example of a quartic polynomial equation with a double root (not simplified)
\[f(x) = x^4+3x^3-17x^2-39x-20\] We can start factoring and simplifying to find the roots
Synthetic division
This is not a super in-depth tutorial on how to do synthetic division, but hopefully it’s somewhat helpful. Synthetic division is a really cool trick that uses the coefficients of a polynomial to divide and factor. The coefficients of this polynomial are \(1\), \(3\), \(-17\), \(-39\), and \(-20\). You line up your coefficients in the order they appear in the equation, like so:
\[\begin{array}{rrrrr} 1 & 3 & -17 & -39 & -20 \\ \end{array}\]
After that, you are then ready to start “dividing”.
\(0\), \(1\), and \(-1\) are always good numbers to start with
\[\begin{array}{c|rrrrr} 0 & 1 & 3 & -17 & -39 & -20 \\ & & 0 & 0 & -13 & 0 \\ \hline & 1 & 3 & -17 & -39 & -20\\ \end{array}\]
You put the starting number in front of all your lined up coefficients and drag down the first coefficient 2 lines. Then, you multiply and add across (\(1*0 = 0\), \(3 + 0 = 3\), \(3*0 = 0\), \(-17+0 = -17\), etc.) The very last number is what the “root” is, and we want that number to be \(0\). Eventually, continuing with 0 as the starting number, we get \(f(0)=-20\), which is not a root. We do the same thing with \(1\).
\[\begin{array}{c|rrrrr} 1 & 1 & 3 & -17 & -39 & -20 \\ & & 1 & 4 & -13 & -52 \\ \hline & 1 & 4 & -13 & -52 & -72\\ \end{array}\]
Not a root. What about \(-1\)?
\[\begin{array}{c|rrrrr} -1 & 1 & 3 & -17 & -39 & -20 \\ & & -1 & -2 & 19 & 20 \\ \hline & 1 & 2 & -19 & -20 & 0\\ \end{array}\]
Huzzah! We have a root! We need 4 though, so we press on. We can’t use the same polynomial that we were using before though, the numbers at the bottom (not including the \(0\)) make our new polynomial. We start 1 degree lower, so the leading term is to the power of 3. We also need to keep that \(-1\) somewhere, which is where the factoring comes in. We can write our new polynomial multiplied by \((x+1)\), so when it’s multiplied out, we keep the same \(f(x)\).
Our new polynomial is \((x+1)(x^3 + 2x^2-19x-20)\), so we list the coefficients again:
\[\begin{array}{rrrr} 1 & 2 & -19 & -20 \\ \end{array}\]
And go through the multiplication and addition again:
\[\begin{array}{c|rrrr} -1 & 1 & 2 & -19 & -20 \\ & & -1 & -1 & 20 \\ \hline & 1 & 1 & -20 & 0 \\ \end{array}\]
I started with \(-1\) because I already knew that it was a root, in different equations it does require a little bit more trial and error. We have another root! Our new polynomial is \((x+1)(x+1)(x^2+x-20)\). The quadratic factors down into \((x-4)(x+5)\), so our fully factored polynomial is:
\[ f(x) = x^4+3x^3-17x^2-39x-20 = (x+1)^2(x-4)(x+5) \] The double root is \((x+1)\), or \(-1\).
This means that all of the roots are \(-1\), \(-1\), \(4\), and \(-5\).
Faster way to get the roots
You can do the factoring and simplification by hand with synthetic division. Or you can make your life just a little bit easier and make the computer do it:
Code
k <- function(x) {x^4+3*x^3-17*x^2-39*x-20}

k(1)
[1] -72Code
k(0)[1] -20Code
k(4)[1] 0Code
k(-5)[1] 0Code
k(-1)[1] 0And here’s the graph!
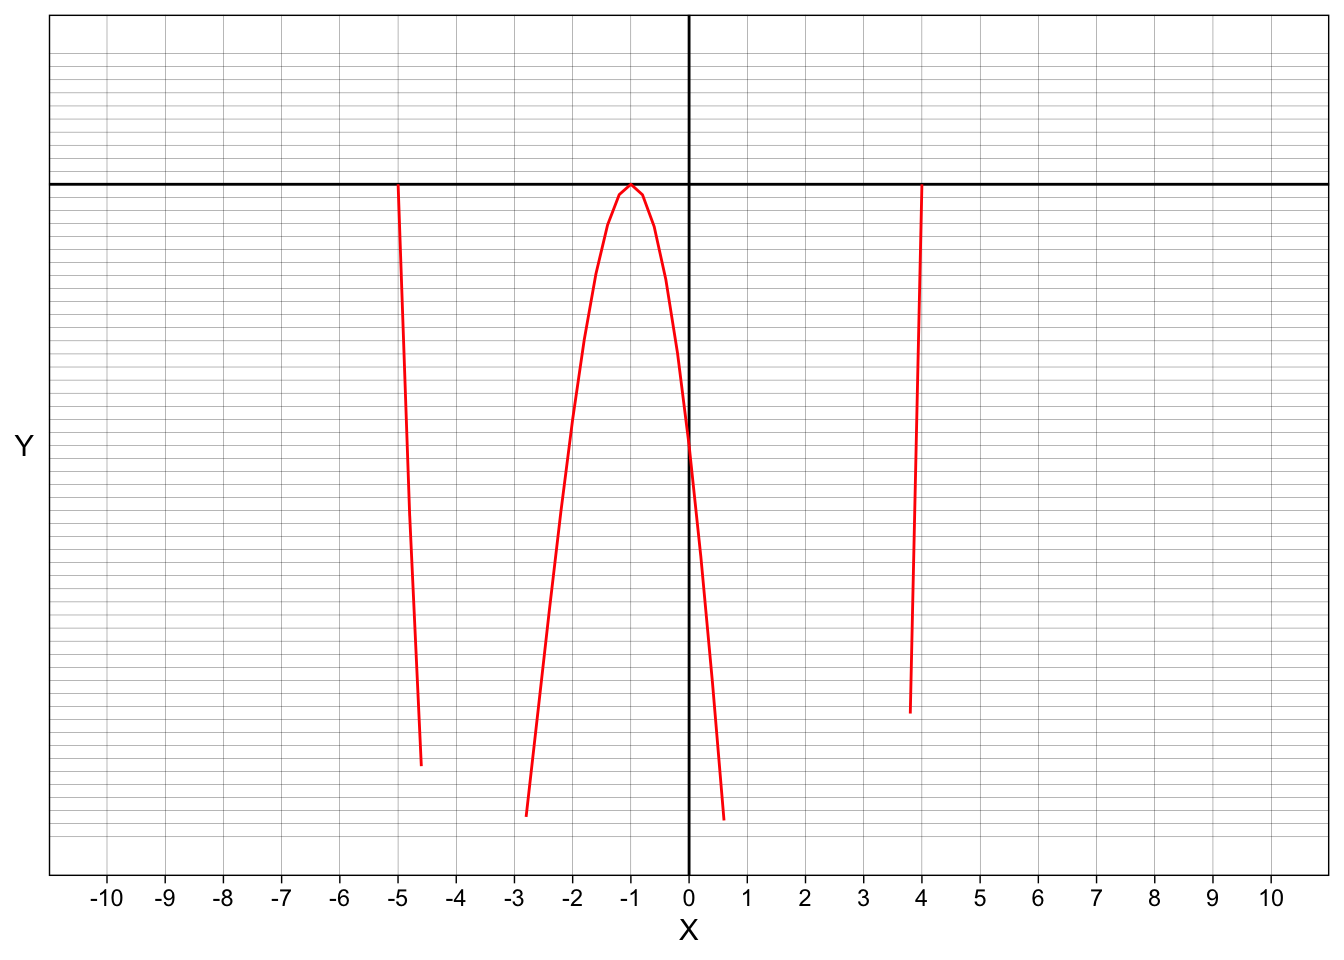
This is a very large quartic polynomial, and goes all the way down to -135, which is why it cuts off in some places. The only place that really matters for our purposes today is the x axis, and you are able to see where the line crosses and bounces off the x axis.
Review
Here are key points about the Fundamental Theorem of Algebra
- If the degree is \(n\) there will be exactly \(n\) roots
- All real roots are complex roots, all real numbers are complex numbers
- Nonreal roots come in pairs
- Polynomials with an odd degree must have at least 1 real root
- If the root crosses over or bounces off the x (or y) axis, it is real
- If the root is elsewhere, it is nonreal